Cerca negli script per "moving average crossover"

EMA Crossover StrategyMoving average crossover systems measure drift in the market. They are great strategies for time-limited people.
So, why don't more people use them?
I think it's due to poor choice in choosing EMA lengths: Market Wizard Ed Seykota has a guideline for moving average crossovers: the slow line should be at least 3x the fast line. This removes a lot of the whipsaws inherent in moving average systems, which means greater profitability. His other piece of advice: long-only strategies are best in stock markets where there's a lot more upside potential.
Using these simple rules, we can reduce a lot of the whipsaws and low profitability trades! This strategy was made so you can see for yourself before trading.
=== HOW TO USE THIS INDICATOR ===
1) Choose your market and timeframe.
2) Choose the length.
3) Choose the multiplier.
4) Choose if the strategy is long-only or bidirectional.
Don't overthink the above! We don't know the best answers, that's why this strategy exists! We're going to test and find out.
After you find a good combination, set up an alert system with the default Exponential Moving Average indicators provided by TradingView.
=== TIPS ===
Increase the multiplier to reduce whipsaws (back and forth trades).
Increase the length to take fewer trades, decrease the length to take more trades.
Try a Long-Only strategy to see if that performs better.

[RS]Moving Average Cross System V0moving average crossover with added functions:
if you want crossover with price set ma1 length to 1, or use as dual ma with both lengths, ability to turn ma's on and off leaving the crossover signals behind, ability to chose ma mode (sma, ema, rma, wma, vwma, swma and alma), ability to chose source (open, high, low, close, hl2, hlc3 or ohlc4).

WIN1! • Crossing EMAs• (By Mesquita, v7)Moving average crossover strategy for intraday movements, especially in the continuous index (WIN1!) on the Brazilian stock exchange B³. The strategy is customizable for time windows, has a filter for trades only above the long-term average, whether only long, only short, or both, with or without stop loss.

Moving Average Crossover This indicator is based on ema 5 and ema 20, when ema 5 crosses over ema 20, the line will be green, when ema 5 crosses down it will be red
This indicator has been accompanied by a strategy so we can see the results through the strategy tester, this strategy there is only a long, I recommend using a weekly timeframe because the volatility is lower and minimal with false signals

Moving Average Crossover 0001The first strategy for my (also first) Everyday project. During the rest of 2016 I plan to create a new strategy everyday
and I give myself between 15 minutes and 2 hours to complete the idea.
The goal is to improve my knowledge of Pine Script, become a faster strategy coder, and experiment with different strategic trading ideas.
I'm new to strategies and algorithmic trading, and hoping to learn from the community, so any feedback, advice or corrections is very much welcome!
/pbergden

Easy MA SignalsEasy MA Signals
Overview
Easy MA Signals is a versatile Pine Script indicator designed to help traders visualize moving average (MA) trends, generate buy/sell signals based on crossovers or custom price levels, and enhance chart analysis with volume-based candlestick coloring. Built with flexibility in mind, it supports multiple MA types, crossover options, and customizable signal appearances, making it suitable for traders of all levels. Whether you're a day trader, swing trader, or long-term investor, this indicator provides actionable insights while keeping your charts clean and intuitive.
Configure the Settings
The indicator is divided into three input groups for ease of use:
General Settings:
Candlestick Color Scheme: Choose from 10 volume-based color schemes (e.g., Sapphire Pulse, Emerald Spark) to highlight high/low volume candles. Select “None” for TradingView’s default colors.
Moving Average Length: Set the MA period (default: 20). Adjust for faster (lower values) or slower (higher values) signals.
Moving Average Type: Choose between SMA, EMA, or WMA (default: EMA).
Show Buy/Sell Signals: Enable/disable signal plotting (default: enabled).
Moving Average Crossover: Select a crossover type (e.g., MA vs VWAP, MA vs SMA50) for signals or “None” to disable.
Volume Influence: Adjust how volume impacts candlestick colors (default: 1.2). Higher values make thresholds stricter.
Signal Appearance Settings:
Buy/Sell Signal Shape: Choose shapes like triangles, arrows, or labels for signals.
Buy/Sell Signal Position: Place signals above or below bars.
Buy/Sell Signal Color: Customize colors for better visibility (default: green for buy, red for sell).
Custom Price Alerts:
Custom Buy/Sell Alert Price: Set specific price levels for alerts (default: 0, disabled). Enter a non-zero value to enable.
Set Up Alerts
To receive notifications (e.g., sound, popup, email) when signals or custom price levels are hit:
Click the Alert button (alarm clock icon) in TradingView.
Select Easy MA Signals as the condition and choose one of the four alert types:
MA Crossover Buy Alert: Triggers on MA crossover buy signals.
MA Crossover Sell Alert: Triggers on MA crossover sell signals.
Custom Buy Alert: Triggers when price crosses above the custom buy price.
Custom Sell Alert: Triggers when price crosses below the custom sell price.
Enable Play Sound and select a sound (e.g., “Bell”).
Set the frequency (e.g., Once Per Bar Close for confirmed signals) and create the alert.
Analyze the Chart
Moving Average Line: Displays the selected MA with color changes (green for bullish, red for bearish, gray for neutral) based on price position relative to the MA.
Buy/Sell Signals: Appear as shapes or labels when crossovers or custom price levels are hit.
Candlestick Colors: If a color scheme is selected, candles change color based on volume strength (high, low, or neutral), aiding in trend confirmation.
Why Use Easy MA Signals?
Easy MA Signals is designed to simplify technical analysis while offering advanced customization. It’s ideal for traders who want:
A clear visualization of MA trends and crossovers.
Flexible signal generation based on MA crossovers or custom price levels.
Volume-enhanced candlestick coloring to identify market strength.
Easy-to-use settings with tooltips for beginners and pros alike.
This script is particularly valuable because it combines multiple features into one indicator, reducing chart clutter and providing actionable insights without overwhelming the user.
Benefits of Easy MA Signals
Highly Customizable: Supports SMA, EMA, and WMA with adjustable lengths.
Offers multiple crossover options (VWAP, SMA10, SMA20, etc.) for tailored strategies.
Custom price alerts allow precise targeting of key levels.
Volume-Based Candlestick Coloring: 10 unique color schemes highlight volume strength, helping traders confirm trends.
Adjustable volume influence ensures adaptability to different markets.
Flexible Signal Visualization: Choose from various signal shapes (triangles, arrows, labels) and positions (above/below bars).
Customizable colors improve visibility on any chart background.
Alert Integration: Built-in alert conditions for crossovers and custom prices support sound, email, and app notifications.
Easy setup for real-time trading decisions.
User-Friendly Design: Organized input groups with clear tooltips make configuration intuitive.
Suitable for beginners and advanced traders alike.
Example Use Cases
Swing Trading with MA Crossovers:
Scenario: A trader wants to trade Bitcoin (BTC/USD) on a 4-hour chart using an EMA crossover strategy.
Setup:
Set Moving Average Type to EMA, Length to 20.
Set Moving Average Crossover to “MA vs SMA50”.
Enable Show Buy/Sell Signals and choose “arrowup” for buy, “arrowdown” for sell.
Select “Emerald Spark” for candlestick colors to highlight volume surges.
Usage: Buy when the EMA20 crosses above the SMA50 (green arrow appears) and volume is high (dark green candles). Sell when the EMA20 crosses below the SMA50 (red arrow). Set alerts for real-time notifications.
Scalping with Custom Price Alerts:
Scenario: A day trader monitors Tesla (TSLA) on a 5-minute chart and wants alerts at specific support/resistance levels.
Setup:
Set Custom Buy Alert Price to 150.00 (support) and Custom Sell Alert Price to 160.00 (resistance).
Use “labelup” for buy signals and “labeldown” for sell signals.
Keep Moving Average Crossover as “None” to focus on price alerts.
Usage: Receive a sound alert and label when TSLA crosses 150.00 (buy) or 160.00 (sell). Use volume-colored candles to confirm momentum before entering trades.
When NOT to Use Easy MA Signals
High-Frequency Trading: Reason: The indicator relies on moving averages and volume, which may lag in ultra-fast markets (e.g., sub-second trades). High-frequency traders may need specialized tools with real-time tick data.
Alternative: Use order book or market depth indicators for faster execution.
Low-Volatility or Sideways Markets:
Reason: MA crossovers and custom price alerts can generate false signals in choppy, range-bound markets, leading to whipsaws.
Alternative: Use oscillators like RSI or Bollinger Bands to trade within ranges.
This indicator is tailored more towards less experienced traders. And as always, paper trade until you are comfortable with how this works if you're unfamiliar with trading! We hope you enjoy this and have great success. Thanks for your interested in Easy MA Signals!

[GrandAlgo] Moving Averages Cross LevelsMoving Averages Cross Levels
Many traders watch for moving average crossovers – such as the golden cross (50 MA crossing above 200 MA) or death cross – as signals of changing trends. However, once a crossover happens, the exact price level where it occurred often fades from view, even though that level can be an important reference point. Moving Averages Cross Levels is an indicator that keeps those crossover price levels visible on your chart, helping you track where momentum shifts occurred and how price behaves relative to those key levels.
This tool plots horizontal line segments at the price where each pair of selected moving averages crossed within a recent window of bars. Each level is labeled with the moving average lengths (for example, “21×50” for a 21/50 MA cross) and is color-coded – green for bullish crossovers (short-term MA crossing above long-term MA) and red for bearish crossunders (short-term crossing below). By visualizing these crossover levels, you can quickly identify past trend change points and use them as potential support/resistance or decision levels in your trading. Importantly, this indicator is non-repainting – once a crossover level is plotted, it remains fixed at the historical price where the cross occurred, allowing you to continually monitor that level going forward. (As with any moving average-based analysis, crossover signals are lagging, so use these levels in conjunction with other tools for confirmation.)
Key Features:
✅ Multiple Moving Averages: Track up to 7 different MAs (e.g. 5, 8, 21, 50, 64, 83, 200 by default) simultaneously. You can enable/disable each MA and set its length, allowing flexible combinations of short-term and long-term averages.
✅ Selectable MA Type: Each average can be calculated as a Simple (SMA), Exponential (EMA), Volume-Weighted (VWMA), or Smoothed (RMA) moving average, giving you flexibility to match your preferred method.
✅ Auto Crossover Detection: The script automatically detects all crosses between any enabled MA pairs, so you don’t have to specify pairs manually. Whether it’s a fast cross (5×8) or a long-term cross (50×200), every crossover within the lookback period will be identified and marked.
✅ Horizontal Level Markers: For each detected crossover, a horizontal line segment is drawn at the exact price where the crossover occurred. This makes it easy to glance at your chart and see precisely where two moving averages intersected in the recent past.
✅ Labeled and Color-Coded: Each crossover line is labeled with the two MA lengths that crossed (e.g. “50×200”) for clear identification. Colors indicate crossover direction – by default green for bullish (positive) crossovers and red for bearish (negative) crossovers – so you can tell at a glance which way the trend shifted. (You can customize these colors in the settings.)
✅ Adjustable Lookback: A “Crosses with X candles” input lets you control how far back the script looks for crossovers to plot. This prevents your chart from getting cluttered with too many old levels – for example, set X = 100 to show crossovers from roughly the last 100 bars. Older crossover lines beyond this lookback window will automatically clear off the chart.
✅ Optional MA Plots: You can toggle the display of each moving average line on the chart. This means you can either view just the crossover levels alone for a clean look, or also overlay the MA curves themselves for additional context (to see how price and MAs were moving around the crossover).
✅ No Repainting or Hindsight Bias: Once a crossover level is plotted, it stays at that fixed price. The indicator doesn’t move levels around after the fact – each line is a true historical event marker. This allows you to backtest visually: see how price acted after the crossover by observing if it retested or respected that level later.
How It Works:
1️⃣ Add to Chart & Configure – Simply add the indicator to your chart. In the settings, choose which moving averages you want to include and set their lengths. For example, you might enable 21, 50, 200 to focus on medium and long-term crosses (including the golden cross), or turn on shorter MAs like 5 and 8 for quick momentum shifts. Adjust the lookback (number of bars to scan for crosses) if needed.
2️⃣ Visualization – The script continuously checks the latest X bars for any points where one MA crossed above or below another. Whenever a crossover is found, it calculates the exact price level at which the two moving averages intersected. On the last bar of your chart, it will draw a horizontal line segment extending from the crossover bar to the current bar at that price level, and place a label to the right of the line with the MA lengths. Green lines/labels signify bullish crossovers (where the first MA crossed above the second), and red lines indicate bearish crossunders.
3️⃣ On Your Chart – You will see these labeled levels aligned with the price scale. For example, if a 50 MA crossed above a 200 MA (bullish) 50 bars ago at price $100, there will be a green “50×200” line at $100 extending to the present, showing you exactly where that golden cross happened. You might notice price pulling back near that level and bouncing, or if price falls back through it, it could signal a failed crossover. The indicator updates in real-time: if a new crossover happens on the latest bar, a new line and label will instantly appear, and if any old cross moves out of the lookback range, its line is removed to keep the chart focused.
4️⃣ Customization – You can fine-tune the appearance: toggle any MA’s visibility, change line colors or label styles, and modify the lookback length to suit different timeframes. For instance, on a 1-hour chart you might use a lookback of 500 bars to see a few weeks of cross history, whereas on a daily chart 100 bars (about 4–5 months) may be sufficient. Adjust these settings based on how many crossover levels you find useful to display.
Ideal for Traders Who:
Use MA Crossovers in Strategy: If your strategy involves moving average crossovers (for trend confirmation or entry/exit signals), this indicator provides an extra layer of insight by keeping the price of those crossover events in sight. For example, trend-followers can watch if price stays above a bullish crossover level as a sign of trend strength, or falls below it as a sign of weakness.
Identify Support/Resistance from MA Events: Crossover levels often coincide with pivot points in market sentiment. A crossover can act like a regime change – the level where it happened may turn into support or resistance. This tool helps you mark those potential S/R levels automatically. Rather than manually noting where a golden cross occurred, you’ll have it highlighted, which can be useful for setting stop-losses (e.g. below the crossover price in a bullish scenario) or profit targets.
Track Multiple Averages at Once: Instead of focusing on just one pair of moving averages, you might be interested in the interaction of several (short, medium, and long-term trends). This indicator caters to that by plotting all relevant crossovers among your chosen MAs. It’s great for multi-timeframe thinkers as well – e.g. you could apply it on a higher timeframe chart to mark major cross levels, then drill down to lower timeframes knowing those key prices.
Value Clean Visualization: There are no flashing signals or arrows – just simple lines and labels that enhance your chart’s storytelling. It’s ideal if you prefer to make trading decisions based on understanding price interaction with technical levels rather than following automatic trade calls. Moving Averages Cross Levels gives you information to act on, without imposing any bias or strategy – you interpret the crossover levels in the context of your own trading system.

MA RSI MACD Signal SuiteThis Pine Script™ is designed for use in Trading View and generates trading signals based on moving average (MA) crossovers, RSI (Relative Strength Index) signals, and MACD (Moving Average Convergence Divergence) indicators. It provides visual markers on the chart and can be configured to suit various trading strategies.
1. Indicator Overview
The indicator includes signals for:
Moving Averages (MA): It tracks crossovers between different types of moving averages.
RSI: Signals based on RSI crossing certain levels or its signal line.
MACD: Buy and sell signals generated by MACD crossovers.
2. Inputs and Customization
Moving Averages (MAs):
You can customize up to 6 moving averages with different types, lengths, and colors.
MA Type: Choose from different types of moving averages:
SMA (Simple Moving Average)
EMA (Exponential Moving Average)
HMA (Hull Moving Average)
SMMA (RMA) (Smoothed Moving Average)
WMA (Weighted Moving Average)
VWMA (Volume Weighted Moving Average)
T3, DEMA, TEMA
Source: Select the price to base the MA on (e.g., close, open, high, low).
Length: Define the number of periods for each moving average.
Examples:
MA1: Exponential Moving Average (EMA) with a period of 9
MA2: Exponential Moving Average (EMA) with a period of 21
RSI Settings:
RSI is calculated based on a user-defined period and is used to identify potential overbought or oversold conditions.
RSI Length: Lookback period for RSI (default 14).
Overbought Level: Defines the overbought threshold for RSI (default 70).
Oversold Level: Defines the oversold threshold for RSI (default 30).
You can also adjust the smoothing for the RSI signal line and customize when to trigger buy and sell signals based on the RSI crossing these levels.
MACD Settings:
MACD is used for identifying changes in momentum and trends.
Fast Length: The period for the fast moving average (default 12).
Slow Length: The period for the slow moving average (default 26).
Signal Length: The period for the signal line (default 9).
Smoothing Method: Choose between SMA or EMA for both the MACD and the signal line.
3. Signal Logic
Moving Average (MA) Crossover Signals:
Crossover: A bullish signal is generated when a fast MA crosses above a slow MA.
Crossunder: A bearish signal is generated when a fast MA crosses below a slow MA.
The crossovers are plotted with distinct colors, and the chart will display markers for these crossover events.
RSI Signals:
Oversold Crossover: A bullish signal when RSI crosses over its signal line below the oversold level (30).
Overbought Crossunder: A bearish signal when RSI crosses under its signal line above the overbought level (70).
RSI signals are divided into:
Aggressive (Early) Entries: Signals when RSI is crossing the oversold/overbought levels.
Conservative Entries: Signals when RSI confirms a reversal after crossing these levels.
MACD Signals:
Buy Signal: Generated when the MACD line crosses above the signal line (bullish crossover).
Sell Signal: Generated when the MACD line crosses below the signal line (bearish crossunder).
Additionally, the MACD histogram is used to identify momentum shifts:
Rising to Falling Histogram: Alerts when the MACD histogram switches from rising to falling.
Falling to Rising Histogram: Alerts when the MACD histogram switches from falling to rising.
4. Visuals and Alerts
Plotting:
The script plots the following on the price chart:
Moving Averages (MA): The selected MAs are plotted as lines.
Buy/Sell Shapes: Triangular markers are displayed for buy and sell signals generated by RSI and MACD.
Crossover and Crossunder Markers: Crosses are shown when two MAs crossover or crossunder.
Alerts:
Alerts can be configured based on the following conditions:
RSI Signals: Alerts for oversold or overbought crossover and crossunder events.
MACD Signals: Alerts for MACD line crossovers or momentum shifts in the MACD histogram.
Alerts are triggered when specific conditions are met, such as:
RSI crosses over or under the oversold/overbought levels.
MACD crosses the signal line.
Changes in the MACD histogram.
5. Example Usage
1. Trend Reversal Setup:
Buy Signal: Use the RSI oversold crossover and MACD bullish crossover to identify potential entry points in a downtrend.
Sell Signal: Use the RSI overbought crossunder and MACD bearish crossunder to identify potential exit points or short entries in an uptrend.
2. Momentum Strategy:
Combine MACD and RSI signals to identify the strength of a trend. Use MACD histogram analysis and RSI levels for confirmation.
3. Moving Average Crossover Strategy:
Focus on specific MA crossovers, such as the 9-period EMA crossing above the 21-period EMA, for buy signals. When a longer-term MA (e.g., 50-period) crosses a shorter-term MA, it may indicate a strong trend change.
6. Alerts Conditions
The script includes several alert conditions, which can be triggered and customized based on the user’s preferences:
RSI Oversold Crossover: Alerts when RSI crosses over the signal line below the oversold level (30).
RSI Overbought Crossunder: Alerts when RSI crosses under the signal line above the overbought level (70).
MACD Buy/Sell Crossover: Alerts when the MACD line crosses the signal line for a buy or sell signal.
7. Conclusion
This script is highly customizable and can be adjusted to suit different trading strategies. By combining MAs, RSI, and MACD, traders can gain multiple perspectives on the market, enhancing their ability to identify potential buy and sell opportunities.

Day Trading MA Crossover IndicatorDay Trading MA Crossover Indicator Overview The Day Trading MA Crossover Indicator is a simple yet effective tool designed for day traders to identify potential buy and sell opportunities based on moving average crossovers. It plots two customizable moving averages on your chart and generates clear visual signals when they cross, helping you spot trend reversals or continuations in fast-paced markets.This indicator is ideal for intraday trading on lower timeframes (e.g., 5-min, 15-min charts) but can be adapted for swing trading or higher timeframes. It's built with flexibility in mind, allowing you to tweak the MA lengths and types to suit your strategy.Key FeaturesMoving Average Crossovers: Generates "BUY" signals when the fast MA crosses above the slow MA (potential bullish entry) and "SELL" signals when it crosses below (potential bearish entry or exit).
Visual Signals: Green "BUY" labels below bars for long entries and red "SELL" labels above bars for short entries or exits. Optional subtle background coloring highlights signals for quick spotting.
Customizable Parameters:Fast MA Length (default: 9): Period for the shorter moving average.
Slow MA Length (default: 21): Period for the longer moving average.
MA Type (default: EMA): Choose between SMA (Simple), EMA (Exponential), or WMA (Weighted) for different smoothing behaviors.
Overlay Mode: Plots directly on your price chart without cluttering separate panes.
Lightweight and Efficient: Minimal computation for real-time performance on TradingView.
How It WorksMoving Averages Calculation: The indicator computes two MAs based on your selected type and lengths using closing prices.
Signal Detection: A buy signal triggers on an upward crossover (fast MA > slow MA), indicating potential momentum shift to the upside. A sell signal triggers on a downward crossunder (fast MA < slow MA), signaling possible downside momentum.
Visual Aids: Signals appear as labeled shapes with optional background tints to emphasize key bars.
Usage TipsFor Day Trading: Apply on volatile instruments like forex pairs, stocks, or crypto. Combine with support/resistance levels or other indicators (e.g., RSI for overbought/oversold confirmation) to filter false signals in ranging markets.
Backtesting: Test on historical data to optimize MA lengths for your asset—shorter periods for aggressive trading, longer for smoother trends.
Risk Management: Always use stop-losses and position sizing. Signals are not foolproof and work best in trending conditions.
Customization: Adjust inputs via the indicator settings panel after adding it to your chart.
Example SetupOn a 5-min EUR/USD chart: Use EMA (9/21) for quick crossovers. Look for buy signals above key support with increasing volume.
Avoid choppy markets where frequent false crossovers ("whipsaws") can occur.
This indicator is provided for educational and informational purposes only. It is not financial advice, and past performance does not guarantee future results. Trading involves risk; consult a professional advisor before using any strategy. If you have feedback or suggestions for improvements, feel free to comment!

[TehThomas] - MA Cross with DisplacementThis TradingView script, "MA Cross with Displacement," is designed to detect potential long and short trade opportunities based on moving average (MA) crossovers combined with price displacement confirmation. The script utilizes two simple moving averages (SMA) and highlights potential trade signals when a crossover occurs alongside a strong price movement (displacement).
Why This Indicator is Useful
This indicator enhances the standard moving average crossover strategy by incorporating a displacement condition, making trade signals more reliable. Many traders rely on moving average crossovers to determine trend reversals, but false signals often occur due to minor price fluctuations. By requiring a significant price movement (displacement), this indicator helps filter out weak or insignificant crossovers, leading to more high-probability trade opportunities.
How It Works
Calculates Two Moving Averages (MA)
The user can set two different MA periods:
MA 1 (blue line): Default period is 9 (shorter-term trend).
MA 2 (red line): Default period is 21 (longer-term trend).
These moving averages smooth out price fluctuations to identify overall trends.
Detects Crossovers
Bullish crossover: The blue MA crosses above the red MA + displacement candle → Potential long signal.
Example of bullish cross with displacement:
Bearish crossover: The blue MA crosses below the red MA + displacement candle → Potential short signal.
Example of bearish cross with displacement:
Confirms Displacement (Strong Price Move)
A price displacement threshold is used (default: 1.1% of the previous candle size).
For a valid trade signal, a crossover must occur alongside a strong price movement.
Bullish Displacement Condition: Price increased by more than the threshold.
Bearish Displacement Condition: Price decreased by more than the threshold.
Visual Indicators on the Chart
Bars are colored green when there is a bullish displacement.
Bars are colored red when there is a bearish displacement.
These color changes help traders quickly identify potential trade setups.
How to Use the Indicator
Add the Script to Your Chart
Copy and paste the script into TradingView's Pine Script Editor.
Click "Add to Chart" to activate it.
Customize the Settings
Adjust the moving average periods to fit your trading strategy.
Modify the displacement threshold based on market volatility.
Change the bar colors for better visualization.
Look for Trade Signals
Long Trade (Buy Signal)
The blue MA crosses above the red MA (bullish crossover).
A green bar appears, confirming bullish displacement.
Short Trade (Sell Signal)
The blue MA crosses below the red MA (bearish crossover).
A red bar appears, confirming bearish displacement.
Use in Conjunction with Other Indicators
This indicator works best when combined with support & resistance levels, RSI, MACD, or volume analysis to improve trade accuracy.
Final Thoughts
The MA Cross with Displacement Indicator improves the reliability of moving average crossovers by requiring strong price movements to confirm a trade signal. This helps traders avoid false breakouts and weak trends, making it a powerful tool for identifying high-probability trades.
__________________________________________
Thanks for your support!
If you found this idea helpful or learned something new, drop a like 👍 and leave a comment—I’d love to hear your thoughts! 🚀
Make sure to follow me for more price action insights, free indicators, and trading strategies. Let’s grow and trade smarter together! 📈✨

FibPulse144 [CHE] FibPulse144 — ADX-gated 13/21 crossover with 144-trend regime and closed-bar labels
Summary
FibPulse144 combines a fast moving-average crossover with a 144-period trend regime and an ADX strength gate. Signals are confirmed on closed bars only and drawn as labels on the price chart, while an ADX line in a separate pane provides context. Color gradients are derived from normalized ADX, so visual intensity reflects trend strength without changing the underlying logic. The approach reduces false flips during weak conditions and keeps entries aligned with the dominant trend.
Motivation: Why this design?
Traditional crossover signals can flip repeatedly during sideways phases and often trigger against the higher-time regime. By requiring alignment with a slower trend proxy and by gating entries through a rising ADX condition, FibPulse144 favors structurally cleaner transitions. Gradient coloring communicates strength visually, helping users temper aggressiveness without additional indicators.
What’s different vs. standard approaches?
Baseline: Classic dual-MA crossover with unconditional signals.
Architecture differences:
Two-bar regime confirmation against a 144-period trend average.
Pending-signal logic that waits for regime and optional ADX approval.
ADX strength gate using the prior reading relative to a user threshold and earlier value.
Gradient colors scaled by an ADX window with gamma controls.
Price-chart labels enforced via overlay on an otherwise pane-based indicator.
Practical effect: Fewer signals during weak or choppy conditions, labels that appear only after a bar closes, and color intensity that mirrors trend quality.
How it works (technical)
The script computes fast and slow moving averages using the selected method and lengths. A separate 144-length average defines the regime using a two-bar confirmation above or below it. Crossovers are observed on the previous bar to avoid intrabar ambiguity; once a prior crossover is detected, it is stored as pending. A pending long requires regime alignment and, if enabled, an ADX condition based on the previous reading being above the threshold and greater than an earlier reading. The state machine holds neutral, long, or short until an exit condition or ADX reset is met. ADX is normalized within a user window, scaled with gamma, and mapped to up and down color palettes to render gradients. Labels on the price panel are forced to overlay, while the ADX line and threshold guide remain in a separate pane.
Parameter Guide
Source — Input data for all calculations. Default: close. Tip: keep consistent with your chart.
MA Type — EMA or SMA. Default: EMA. EMA reacts faster; SMA is smoother.
Fast / Slow — Fast and slow lengths for crossover. Defaults: 13 and 21. Shorter reacts earlier; longer reduces noise.
Trend — Regime average length. Default: 144. Larger values stabilize regime; smaller values increase sensitivity.
Use 144 as trend filter — Enables regime gating. Default: true. Disable to allow raw crossovers.
Use ADX filter — Requires ADX strength. Default: true. Disable to allow signals regardless of strength.
ADX Len — DI and ADX smoothing length. Default: 14. Higher values smooth strength; lower values react faster.
ADX Thresh — Minimum strength for signals. Default: 25. Raise to reduce flips; lower to capture earlier moves.
Entry/Exit labels (price) — Price-panel labels on state changes. Default: true.
Signal labels in ADX pane — Small markers at the ADX value on entries. Default: true.
Label size — tiny, small, normal, large. Default: normal.
Enable barcolor — Optional candle tint by regime and gradient. Default: false.
Enable gradient — Turns on ADX-driven color blending. Default: true.
Window — Bars used to normalize ADX for colors. Default: 100; minimum: 5.
Gamma bars / Gamma plots — Nonlinear scaling for bar and line intensities. Default: 0.80; between 0.30 and 2.00.
Gradient transp (0–90) — Transparency for gradient colors. Default: 0.
MA fill transparency (0–100) — Fill opacity between fast and slow lines. Default: 65.
Palette colors (Up/Down) — Dark and neon endpoints for up and down gradients. Defaults as in the code.
Reading & Interpretation
Fast/Slow lines: When the fast line is above the slow line, the line and fill use the long palette; when below, the short palette is used.
Trend MA (144): Neutral gray line indicating the regime boundary.
Labels on price: “LONG” appears when the state turns long; “SHORT” when it turns short. Labels appear only after the bar closes and conditions are satisfied.
ADX pane: The ADX line shows current strength. The dotted threshold line is the user level for gating. Optional small markers indicate entries at the ADX value.
Bar colors (optional): Candle tint intensity reflects normalized ADX. Higher intensity implies stronger conditions.
Practical Workflows & Combinations
Trend following: Use long entries when fast crosses above slow and price has held above the trend average for two bars, with ADX above threshold. Mirror this for shorts below the trend average.
Exits and stops: Consider reducing exposure when price closes on the opposite side of the trend average for two consecutive bars or when ADX fades below the threshold if the ADX filter is enabled.
Structure confirmation: Combine with higher-timeframe structure such as swing highs and lows or a simple market structure overlay for confirmation.
Multi-asset/Multi-TF: Works across liquid assets. For lower timeframes, consider a slightly lower ADX threshold; for higher timeframes, maintain or raise the threshold to avoid unnecessary flips.
Behavior, Constraints & Performance
Repaint/confirmation: Signals are based on previous-bar crossovers and are confirmed on bar close. No higher-timeframe or security calls are used. Intrabar markers are not relied upon.
Resources: The script declares `max_bars_back` of 2000, uses no loops or arrays, and employs persistent variables for pending signals and state.
Known limits: Crossover systems can lag after sudden reversals. During tight ranges, disabling the ADX filter may increase flips; keeping it enabled may skip early transitions.
Sensible Defaults & Quick Tuning
Starting point: EMA, 13/21/144, ADX length 14, ADX threshold 25, gradients on, barcolor off.
Too many flips: Increase ADX threshold or length; increase trend length; consider SMA instead of EMA.
Too sluggish: Lower ADX threshold slightly; shorten fast and slow lengths; reduce the trend length.
Colors overpowering: Increase gradient transparency or reduce gamma values toward one.
What this indicator is—and isn’t
This is a visualization and signal layer that combines crossover, regime, and strength gating. It does not predict future movements, manage risk, or execute trades. Use it alongside clear structure, risk controls, and a defined position management plan.
Disclaimer
The content provided, including all code and materials, is strictly for educational and informational purposes only. It is not intended as, and should not be interpreted as, financial advice, a recommendation to buy or sell any financial instrument, or an offer of any financial product or service. All strategies, tools, and examples discussed are provided for illustrative purposes to demonstrate coding techniques and the functionality of Pine Script within a trading context.
Any results from strategies or tools provided are hypothetical, and past performance is not indicative of future results. Trading and investing involve high risk, including the potential loss of principal, and may not be suitable for all individuals. Before making any trading decisions, please consult with a qualified financial professional to understand the risks involved.
By using this script, you acknowledge and agree that any trading decisions are made solely at your discretion and risk.
Do not use this indicator on Heikin-Ashi, Renko, Kagi, Point-and-Figure, or Range charts, as these chart types can produce unrealistic results for signal markers and alerts.
Best regards and happy trading
Chervolino

WILDER'S Moving Average by fr3762 KIVANCThe Wilder’s Moving Average indicator (Wilder’s Smoothed Moving Average ) was developed by Welles Wilder and introduced in his 1978 book, “New Concepts in Technical Trading Systems.” Mr. Wilder did not use the standard EMA formula; instead, the following formula is used: EMA = Input * K + EMA * (1-K), where K = 2 / (N+1). Then to find the Wilder’s Moving Average, the following calculation is performed: Input * K + EMA * (1-K), where K =1/N.
Type to use
Moving averages are commonly used to identify trends and reversals as well as identifying support and resistance levels. Moving averages such the WMA and EMA , which are more sensitive to recent prices (experience less lag with price) will turn before an SMA . They are therefore more suitable for dynamic trades, which are reactive to short term price movements. Moving averages such as the SMA move more slowly providing valuable information on the long dominant trend. They can however be prone to giving late signals causing the trader to miss significant parts of the price movement.
Trade Signals
Moving Average Crossovers: Moving average crossovers is a term applied when more than one moving average is used to generate a trade signal where traders will act when the shorter term moving average crosses the longer term moving average. A bullish crossover occurs when the shorter term moving average crosses above the longer term moving average (golden cross). A bearish crossover occurs where the shorter term moving average crosses below the longer term moving average (dead cross).
Price crossovers: A Price crossover is a term applied when a signal is generated where the price crosses a moving average. Bullish signals are given when the price moves above the moving average, bearish signals are given when the price moves below the moving average. Crossover trades are more likely to enjoy success when the moving average slopes are in the direction of the trade.
Support and Resistance: Moving averages can also act as a support level in an uptrend and resistance levels in a downtrend. If the average is widely followed orders in favour of the trend often cluster around the average. As markets are often driven by emotion and many players trade counter to the trend expect overshoots, to this extent the average should be used to identify support and resistance zones rather than exact levels.
from: mahifx.com
Developed by WELLES WILDER
MACD-X Overlay, More Than MACD by DGTMoving Average Convergence Divergence – MACD
The most popular indicator used in technical analysis , the moving average convergence divergence ( MACD ), created by Gerald Appel. MACD is a trend-following momentum indicator , designed to reveal changes in the strength, direction, momentum, and duration of a trend in a financial instrument’s price
Historical evolution of MACD ,
- Gerald Appel created the MACD line,
- Thomas Aspray added the histogram feature to MACD
- Giorgos E. Siligardos created a leader of MACD
MACD employs two Moving Averages of varying lengths (which are lagging indicators) to identify trend direction and duration. Then, MACD takes the difference in values between those two Moving Averages (MACD Line) and an EMA of those Moving Averages (Signal Line) and plots that difference between the two lines as a histogram which oscillates above and below a center Zero Line. The histogram is used as a good indication of a security's momentum.
The MACD indicator is typically good for identifying three types of basic signals;
Signal Line Crossovers
A Signal Line Crossover is the most common signal produced by the MACD . On the occasions where the MACD Line crosses above or below the Signal Line, that can signify a potentially strong move. The standard interpretation of such an event is a recommendation to buy if the MACD line crosses up through the Signal Line (a "bullish" crossover), or to sell if it crosses down through the Signal Line (a "bearish" crossover). These events are taken as indications that the trend in the financial instrument is about to accelerate in the direction of the crossover.
Zero Line Crossovers
Zero Line Crossovers occur when the MACD Line crossed the Zero Line and either becomes positive (above 0) or negative (below 0). A change from positive to negative MACD is interpreted as "bearish", and from negative to positive as "bullish". Zero crossovers provide evidence of a change in the direction of a trend but less confirmation of its momentum than a signal line crossover
Divergence
Divergence is another signal created by the MACD . Simply, divergence occurs when the MACD and actual price are not in agreement. A "positive divergence" or "bullish divergence" occurs when the price makes a new low but the MACD does not confirm with a new low of its own. A "negative divergence" or "bearish divergence" occurs when the price makes a new high but the MACD does not confirm with a new high of its own. A divergence with respect to price may occur on the MACD line and/or the MACD Histogram
Moving Average Crossovers , another hidden signal that MACD Indicator identifies
Many traders will watch for a short-term moving average to cross above a longer-term moving average and use this to signal increasing upward momentum. This bullish crossover suggests that the price has recently been rising at a faster rate than it has in the past, so it is a common technical buy sign. Conversely, a short-term moving average crossing below a longer-term average is used to illustrate that the asset's price has been moving downward at a faster rate and that it may be a good time to sell.
Moving Average Crossovers in reality is Zero Line Crossovers, the value of the MACD indicator is equal to zero each time the two moving averages cross over each other. For easy interpretation by trades, Zero Line Crossovers are simply described as positive or negative MACD
False signals
Like any forecasting algorithm, the MACD can generate false signals. A false positive, for example, would be a bullish crossover followed by a sudden decline in a financial instrument. A false negative would be a situation where there is bearish crossover, yet the financial instrument accelerated suddenly upwards
What is “MACD-X” and Why it is “More Than MACD”
In its simples form, MACD-X implements variety of different calculation techniques applied to obtain MACD Line. Different calculation techniques lead to different values for MACD Line, as will further discuss below, and as a consequence the signal line and the histogram values will differentiate accordingly.
Main features of MACD-X ;
1- Plotting of the Oscillator presented on top of the price chart (main chart) and applicable on both log and linear scale. Maximum plotting length is limited to 250 bars
2- Introduces different proven techniques applied on MACD calculation, such as MACD-AS (Histogram), MACD-Leader and MACD-Source, besides the traditional MACD (MACD-TRADITIONAL)
• MACD-Traditional, by Gerald Appel
It is the MACD that we know, stated as traditional just to avoid confusion with other techniques used with this study
• MACD-Histogram, by Thomas Aspray
The MACD-Histogram measures the distance between MACD and its signal line (the 9-day EMA of MACD ). Aspray developed the MACD-Histogram to anticipate signal line crossovers in MACD . Because MACD uses moving averages and moving averages lag price, signal line crossovers can come late and affect the reward-to-risk ratio of a trade. Bullish or bearish divergences in the MACD-Histogram can alert chartists to an imminent signal line crossover in MACD
Aspray's contribution served as a way to anticipate (and therefore cut down on lag) possible MACD crossovers which are a fundamental part of the indicator.
• MACD-Leader, by Giorgos E. Siligardos, PhD
MACD Leader has the ability to lead MACD at critical situations. Almost all smoothing methods encounter in technical analysis are based on a relative-weighted sum of past prices, and the Leader is no exception. The concealed weights of MACD Leader are such that more relative weight is used in the more recent prices than the respective weights used by the components of MACD . In effect, the Leader expresses more changes in average price dynamics for the recent price movement than MACD , thus eventually leading MACD , especially when significant trend changes are about to take place.
• MACD-Source, a custom experimental interpretation of mine,
MACD Source, presents an application of MACD that evaluates Source/MA Ratio, relatively with less lag, as a basis for MACD Line, also can be expressed as source convergence/divergence to its moving average. Among the various techniques for removing the lag between price and moving average (MA) of the price, one in particular stands out: the addition to the moving average of a portion of the difference between the price and MA. MACD Source, is based on signal length mean of the difference between Source and average value of shot length and long length moving average of the source (Source/MA Ratio), where the source is actual value and hence no lag and relatively less lag with the average value of moving average of the source .
MACD Source provides relatively early crossovers comparing to MACD and better momentum direction indications, assuming the lengths are set to same values
3- Alerts presented for MACD and Signal Line Crosses both for Early Warning and Confirmed Crossovers
For more, You are kindly invited to have a look to other MACD or similar studies presented on separate pane
MACD-X, More Than MACD by DGT , P-MACD by DGT and Price Distance to its MA by DGT
Disclaimer : Trading success is all about following your trading strategy and the indicators should fit within your trading strategy, and not to be traded upon solely
The script is for informational and educational purposes only. Use of the script does not constitutes professional and/or financial advice. You alone the sole responsibility of evaluating the script output and risks associated with the use of the script. In exchange for using the script, you agree not to hold dgtrd TradingView user liable for any possible claim for damages arising from any decision you make based on use of the script

MACD-X, More Than MACD by DGTMoving Average Convergence Divergence – MACD
The most popular indicator used in technical analysis, the moving average convergence divergence (MACD), created by Gerald Appel. MACD is a trend-following momentum indicator, designed to reveal changes in the strength, direction, momentum, and duration of a trend in a financial instrument’s price
Historical evolution of MACD,
- Gerald Appel created the MACD line,
- Thomas Aspray added the histogram feature to MACD
- Giorgos E. Siligardos created a leader of MACD
MACD employs two Moving Averages of varying lengths (which are lagging indicators) to identify trend direction and duration. Then, MACD takes the difference in values between those two Moving Averages (MACD Line) and an EMA of those Moving Averages (Signal Line) and plots that difference between the two lines as a histogram which oscillates above and below a center Zero Line. The histogram is used as a good indication of a security's momentum.
Mathematically expressed as;
macd = ma(source, fast_length) – ma(source, slow_length)
signal = ma(macd, signal_length)
histogram = macd – signal
where exponential moving average (ema) is in common use as a moving average (ma)
fast_length = 12
slow_length = 26
signal_length = 9
The MACD indicator is typically good for identifying three types of basic signals ;
Signal Line Crossovers
A Signal Line Crossover is the most common signal produced by the MACD. On the occasions where the MACD Line crosses above or below the Signal Line, that can signify a potentially strong move. The standard interpretation of such an event is a recommendation to buy if the MACD line crosses up through the Signal Line (a "bullish" crossover), or to sell if it crosses down through the Signal Line (a "bearish" crossover). These events are taken as indications that the trend in the financial instrument is about to accelerate in the direction of the crossover.
Zero Line Crossovers
Zero Line Crossovers occur when the MACD Line crossed the Zero Line and either becomes positive (above 0) or negative (below 0). A change from positive to negative MACD is interpreted as "bearish", and from negative to positive as "bullish". Zero crossovers provide evidence of a change in the direction of a trend but less confirmation of its momentum than a signal line crossover
Divergence
Divergence is another signal created by the MACD. Simply, divergence occurs when the MACD and actual price are not in agreement. A "positive divergence" or "bullish divergence" occurs when the price makes a new low but the MACD does not confirm with a new low of its own. A "negative divergence" or "bearish divergence" occurs when the price makes a new high but the MACD does not confirm with a new high of its own. A divergence with respect to price may occur on the MACD line and/or the MACD Histogram
Moving Average Crossovers , another hidden signal that MACD Indicator identifies
Many traders will watch for a short-term moving average to cross above a longer-term moving average and use this to signal increasing upward momentum. This bullish crossover suggests that the price has recently been rising at a faster rate than it has in the past, so it is a common technical buy sign. Conversely, a short-term moving average crossing below a longer-term average is used to illustrate that the asset's price has been moving downward at a faster rate and that it may be a good time to sell.
Moving Average Crossovers in reality is Zero Line Crossovers, the value of the MACD indicator is equal to zero each time the two moving averages cross over each other. For easy interpretation by trades, Zero Line Crossovers are simply described as positive or negative MACD
False signals
Like any forecasting algorithm, the MACD can generate false signals. A false positive, for example, would be a bullish crossover followed by a sudden decline in a financial instrument. A false negative would be a situation where there is bearish crossover, yet the financial instrument accelerated suddenly upwards
What is “MACD-X” and Why it is “More Than MACD”
In its simples form, MACD-X implements variety of different calculation techniques applied to obtain MACD Line, ability to use of variety of different sources , including Volume related sources, and can be plotted along with MACD in the same window and all those features are available and presented within a single indicator, MACD-X
Different calculation techniques lead to different values for MACD Line, as will further discuss below, and as a consequence the signal line and the histogram values will differentiate accordingly. Mathematical calculation of both signal line and the histogram remain the same.
Main features of MACD-X ;
1- Introduces different proven techniques applied on MACD calculation , such as MACD-Histogram, MACD-Leader and MACD-Source, besides the traditional MACD (MACD-TRADITIONAL)
• MACD-Traditional , by Gerald Appel
It is the MACD that we know, stated as traditional just to avoid confusion with other techniques used with this study
• MACD-Histogram , by Thomas Aspray
The MACD-Histogram measures the distance between MACD and its signal line (the 9-day EMA of MACD). Aspray developed the MACD-Histogram to anticipate signal line crossovers in MACD. Because MACD uses moving averages and moving averages lag price, signal line crossovers can come late and affect the reward-to-risk ratio of a trade. Bullish or bearish divergences in the MACD-Histogram can alert chartists to an imminent signal line crossover in MACD
The MACD-Histogram represents the difference between MACD and its 9-day EMA, the signal line. Mathematically,
macdx = macd - ma(macd, signal_length)
Aspray's contribution served as a way to anticipate (and therefore cut down on lag) possible MACD crossovers which are a fundamental part of the indicator.
Here come a question, what if repeat the same calculations once more (macdh2 = macdh - ma(macdh, signal_length), will it be even better, this question will remain to be tested
• MACD-Leader , by Giorgos E. Siligardos, PhD
MACD Leader has the ability to lead MACD at critical situations. Almost all smoothing methods encounter in technical analysis are based on a relative-weighted sum of past prices, and the Leader is no exception. The concealed weights of MACD Leader are such that more relative weight is used in the more recent prices than the respective weights used by the components of MACD. In effect, the Leader expresses more changes in average price dynamics for the recent price movement than MACD, thus eventually leading MACD, especially when significant trend changes are about to take place.
Siligardos creates two less-laggard moving averages indicators in its formula using the same periods as follows
Indicator1 = ma(source, fast_length) + ma(source - ma(source, fast_length), fast_length)
Indicator2 = ma(source, slow_length) + ma(source - ma(source, slow_length), slow_length)
and then take the difference:
Indicator1 - Indicator2
The result is a new MACD Leader indicator
macdx = macd + ma(source - fast_ma, fast_length) - ma(source - slow_ma, slow_length)
• MACD-Source , a custom experimental interpretation of mine ,
MACD Source, presents an application of MACD that evaluates Source/MA Ratio, relatively with less lag, as a basis for MACD Line, also can be expressed as source convergence/divergence to its moving average. Among the various techniques for removing the lag between price and moving average (MA) of the price, one in particular stands out: the addition to the moving average of a portion of the difference between the price and MA. MACD Source, is based on signal length mean of the difference between Source and average value of shot length and long length moving average of the source (Source/MA Ratio), where the source is actual value and hence no lag and relatively less lag with the average value of moving average of the source . Mathematically expressed as,
macdx = ma(source - avg( ma(source, fast_length), ma(source, slow_length) ), signal_length)
MACD Source provides relatively early crossovers comparing to MACD and better momentum direction indications, assuming the lengths are set to same values
For further details, you are invited to check the following two studies, where the first seeds were sown of the MACD-Source idea
Price Distance to its Moving Averages study, adapts the idea of “Prices high above the moving average (MA) or low below it are likely to be remedied in the future by a reverse price movement", presented in an article by Denis Alajbeg, Zoran Bubas and Dina Vasic published in International Journal of Economics, Commerce and Management
First MACD like interpretation comes with the second study named as “ P-MACD ”, where P stands for price, P-MACD study attempts to display relationship between Price and its 20 and 200-period moving average. Calculations with P-MACD were based on price distance (convergence/divergence) to its 200-period moving average, and moving average convergence/divergence of 20-period moving average to 200-period moving average of price.
Now as explained above, MACD Source is a one adapted with traditional MACD, where Source stands for Price, Volume Indicator etc, any source applicable with MACD concept
2- Allows usage of variety of different sources, including Volume related indicators
The most common usage of Source for MACD calculation is close value of the financial instruments price. As an experimental approach, this study will allow source to be selected as one of the following series;
• Current Close Price (close)
• Average of High, Low, and Close Price (hlc3)
• On Balance Volume (obv)
• Accumulation Distribution (accdist)
• Price Volume Trend (pvt)
Where,
-Current Close Price and Average of High, Low, and Close Price are price actions of the financial instrument
- Accumulation Distribution is a volume based indicator designed to measure underlying supply and demand
- On Balance Volume (OBV) , is a momentum indicator that measures positive and negative volume flow
- Price Volume Trend (PVT) is a momentum based indicator used to measure money flow
3- Can be plotted along with MACD in the same window using the same scaling
Default setting of MACD-X will display MACD-Source with Current Close Price as a source and traditional MACD can be plotted eighter as a companion of MACD-X or can be selected to be plotted alone.
Applying both will add ability to compare, or use as a confirmation of one other
In case, traditional MACD Is plotted along with MACD-X to avoid misinterpreting, the lines plotted, the area between MACD-X Line and Signal-X Line is highlighted automatically, even if the highlight option not selected. Otherwise highlight will be applied only if that option selected
4- 4C Histogram
Histogram is plotted with four colors to emphasize the momentum and direction
5- Customizable
Additional to ability of selecting Calculation Method, Source, plotting along with MACD, there are few other option that allows users to customize the MACD-X indicator
Lengths are configurable, default values are set as 12, 26, 9 respectively for fast, slow and smoothing length. Setting lengths to 8,21,5 respectively Is worth checking, slower length moving averages will lead to less lag and earlier reaction to price actions but yet requires a caution and back testing before applying
Highlight the area between MACD-X Line and Signal-X Line, with colors emphasising the direction
Label can be added to display Calculation Method, Source and Length settings, the aim of this label is to server only as a reminder to trades to be aware of settings while they are occupied with charts, analysis etc.
Here comes another question, which is of more importance having the reminder or having the indicators with multi timeframe feature? Build-in Multi Time Frame features of Pine is not supported when labels and lines introduced in the script, there are other methods but brings complexity. To be studied further, this version will be with labels for time being.
Epilogue
MACD-X is an alternative variant of MACD, the insight/signals provided by MACD are also applicable to MACD-X with early and clear warnings for the changes in the trend.
If MACD is essential to your analysis, then it is my guess that after using the MACD-X for a while and familiarizing yourself with its unique character and personality, you will make it an inseparable companion to other indicators in your charts.
The various signals generated by MACD/MACD-X are easily interpreted and very few indicators in technical analysis have proved to be more reliable than the MACD, and this relatively simple indicator can quickly be incorporated into any short-term trading strategy
Disclaimer : Trading success is all about following your trading strategy and the indicators should fit within your trading strategy, and not to be traded upon solely
The script is for informational and educational purposes only. Use of the script does not constitutes professional and/or financial advice. You alone the sole responsibility of evaluating the script output and risks associated with the use of the script. In exchange for using the script, you agree not to hold dgtrd TradingView user liable for any possible claim for damages arising from any decision you make based on use of the script

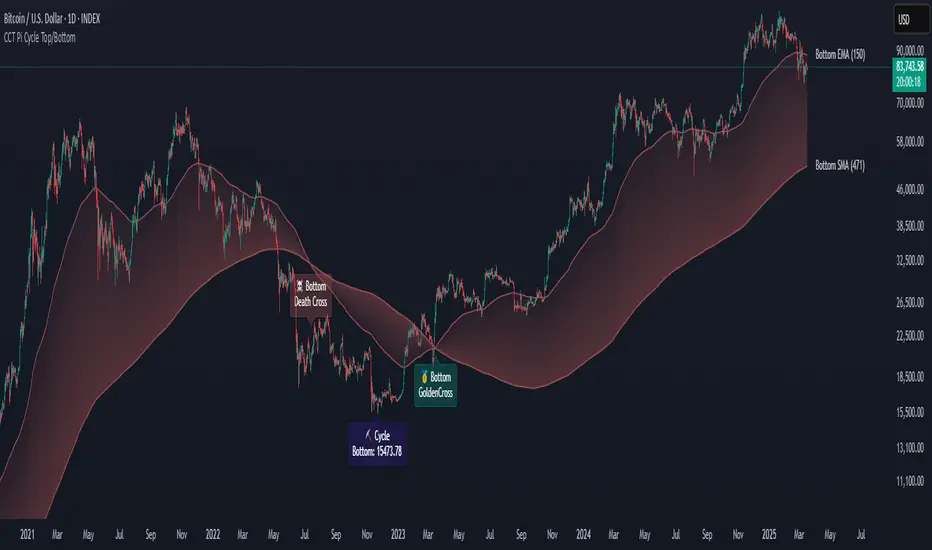
CCT Pi Cycle Top/BottomPi Cycle Top/bottom: The Ultimate Market Cycle Indicator
Introduction
The Pi Cycle Top/bottom Indicator is one of the most reliable tools for identifying Bitcoin market cycle peaks and bottoms. Its effectiveness lies in the strategic combination of moving averages that historically align with major market cycle reversals. Unlike traditional moving average crossovers, this indicator applies an advanced iterative approach to pinpoint price extremes with higher accuracy.
This version, built entirely with Pine Script™ v6, introduces unprecedented precision in detecting both the Pi Cycle Top and Pi Cycle Bottom, eliminating redundant labels, optimizing visual clarity, and ensuring the indicator adapts dynamically to evolving market conditions.
What is the Pi Cycle Theory?
The Pi Cycle Top and Pi Cycle Bottom were originally introduced based on a simple yet profound discovery: key moving average crossovers consistently align with macro market tops and bottoms.
Pi Cycle Top: The crossover of the 111-day Simple Moving Average (SMA) and the 350-day SMA multiplied by 2 has historically signaled market tops with astonishing accuracy.
Pi Cycle Bottom: The intersection of the 150-day Exponential Moving Average (EMA) and the 471-day SMA has repeatedly marked significant market bottoms.
While traditional moving average strategies often suffer from lag and false signals, the Pi Cycle Indicator enhances accuracy by applying a range-based scanning methodology, ensuring that only the most critical reversals are detected.
How This Indicator Works
Unlike basic moving average crossovers, this script introduces a unique iteration process to refine the detection of Pi Cycle points. Here’s how it works:
Detecting Crossovers:
Identifies the Golden Cross (bullish crossover) and Death Cross (bearish crossover) for both the Pi Cycle Top and Pi Cycle Bottom.
Iterating Through the Cycle:
Instead of plotting a simple crossover point, this script scans the range between each Golden and Death Cross to identify the absolute lowest price (Pi Cycle Bottom) and highest price (Pi Cycle Top) within that cycle.
Precision Labeling:
The indicator dynamically adjusts label positioning:
If the price at the crossover is below the fast moving average → the label is placed on the moving average with a downward pointer.
If the price is above the fast moving average → the label is placed below the candle with an upward pointer.
This ensures optimal visibility and prevents misleading signal placement.
Advanced Pine Script v6 Features:
Labels and moving average names are only shown on the last candle, reducing chart noise while maintaining clarity.
Offers full user customization, allowing traders to toggle:
Pi Cycle Top & Bottom visibility
Moving average labels
Crossover labels
Why This Indicator is Superior
This script is not just another moving average crossover tool—it is a market cycle tracker designed for long-term investors and analysts who seek:
✔ High-accuracy macro cycle identification
✔ Elimination of false signals using an iterative range-based scan
✔ Automatic detection of market extremes without manual adjustments
✔ Optimized visuals with smart label positioning
✔ First-of-its-kind implementation using Pine Script™ v6 capabilities
How to Use It?
Bull Market Tops:
When the Pi Cycle Top indicator flashes, consider the potential for a market cycle peak.
Historically, Bitcoin has corrected significantly after these signals.
Bear Market Bottoms:
When the Pi Cycle Bottom appears, it suggests a macro accumulation phase.
These signals have aligned perfectly with historical cycle bottoms.
Final Thoughts
The Pi Cycle Top/bottom Indicator is a must-have tool for traders, investors, and analysts looking to anticipate long-term trend reversals with precision. With its refined methodology, superior label positioning, and cutting-edge Pine Script™ v6 optimizations, this is the most reliable version ever created.
Waldo Cloud Bollinger Bands
Waldo Cloud Bollinger Bands Indicator Description for TradingView
Title: Waldo Cloud Bollinger Bands
Short Title: Waldo Cloud BB
Overview:
The Waldo Cloud Bollinger Bands indicator is a sophisticated tool designed for traders looking to combine the volatility analysis of Bollinger Bands with the momentum insights of the Relative Strength Index (RSI) and moving average crossovers. This indicator overlays on your chart, providing a visual representation that helps in identifying potential trading opportunities based on price action, momentum, and trend direction.
Concept:
This indicator merges three key technical analysis concepts:
Bollinger Bands: These are used to measure market volatility. The bands consist of a central moving average (basis) with an upper and lower band that are standard deviations away from this average. In this indicator, you can customize the type of moving average used for the basis (SMA, EMA, SMMA, WMA, VWMA), the length of the period, the source price, and the standard deviation multiplier, offering flexibility to adapt to different market conditions.
Relative Strength Index (RSI): The RSI is incorporated to provide insight into the momentum of price movements. Users can adjust the RSI length and overbought/oversold levels and even choose the price source for RSI calculation, allowing for tailored momentum analysis. The RSI values influence the cloud color between the Bollinger Bands, signaling market conditions.
Moving Average Crossovers: Two moving averages with customizable lengths and types are used to identify trend direction through crossovers. A fast MA (default 20 periods) and a slow MA (default 50 periods) are plotted when enabled, helping to signal potential bullish or bearish market conditions when they cross over each other.
Functionality:
Bollinger Bands Calculation: The basis of the Bollinger Bands is calculated using a user-defined moving average type, with a customizable length, source, and standard deviation multiplier. The upper and lower bands are then plotted around this basis.
RSI Calculation: The RSI is computed using a user-specified source, length, and overbought/oversold levels. This RSI value is used to determine the color of the cloud between the Bollinger Bands, which visually represents market sentiment:
Purple when RSI is overbought.
Blue when RSI is oversold.
Green for bullish conditions (when the fast MA crosses above the slow MA, RSI is bullish, and the price is above the slow MA).
Red for bearish conditions (when the fast MA crosses below the slow MA, RSI is bearish, and the price is below the slow MA).
Gray for neutral conditions.
Trend Analysis: The indicator uses two moving averages to help determine the trend direction.
When the fast MA crosses over the slow MA, it suggests a potential change in trend direction, which, combined with RSI conditions, provides a more comprehensive trading signal.
Customization:
Users can select the type of moving average for all calculations through the "Global MA Type" setting, ensuring consistency in how trends and volatility are interpreted.
The Bollinger Bands settings allow for adjustments in length, source, standard deviation, and offset, giving traders control over how volatility is measured.
RSI settings include the ability to change the RSI source, length, and overbought/oversold thresholds, which can be fine-tuned to match trading strategies.
The option to show or hide moving averages provides clarity on the chart, focusing on either the Bollinger Bands or including the MA crossovers for trend analysis.
Usage:
This indicator is ideal for traders who incorporate both volatility and momentum in their trading decisions.
By observing the color changes in the cloud, along with the position of the price relative to the moving averages, traders can gauge potential entry and exit points.
For instance, a green cloud with a price above the slow MA might suggest a strong buying opportunity, while a red cloud with a price below might indicate selling pressure.
Conclusion:
The Waldo Cloud Bollinger Bands indicator offers a unique blend of volatility, momentum, and trend analysis, providing traders with a multi-faceted view of market conditions. Its customization options make it adaptable to various trading styles and market environments, making it a valuable addition to any trader's toolkit on Trading View.

[blackcat] L1 MartinGale Scalping Strategy**MartinGale Strategy** is a popular money management strategy used in trading. It is commonly applied in situations where the trader aims to recover from a losing streak by increasing the position size after each loss.
In the MartinGale Strategy, after a losing trade, the trader doubles the position size for the next trade. This is done in the hopes that a winning trade will eventually occur, which will not only recover the previous losses but also generate a profit.
The idea behind the MartinGale Strategy is to take advantage of the law of averages. By increasing the position size after each loss, the strategy assumes that eventually, a winning trade will occur, which will not only cover the previous losses but also generate a profit. This can be especially appealing for traders looking for a quick recovery from a losing streak.
However, it is important to note that the MartinGale Strategy carries significant risks. If a trader experiences a prolonged losing streak or lacks sufficient capital, the strategy can lead to substantial losses. The strategy's reliance on the assumption of a winning trade can be dangerous, as there is no guarantee that a winning trade will occur within a certain timeframe.
Traders considering implementing the MartinGale Strategy should carefully assess their risk tolerance and thoroughly understand the potential drawbacks. It is crucial to have a solid risk management plan in place to mitigate potential losses. Additionally, traders should be aware that the strategy may not be suitable for all market conditions and may require adjustments based on market volatility.
In summary, the MartinGale Strategy is a money management strategy that involves increasing the position size after each loss in an attempt to recover from a losing streak. While it can offer the potential for quick recovery, it also comes with significant risks that traders should carefully consider before implementing it in their trading approach.
The MartinGale Scalping Strategy is a trading strategy designed to generate profits through frequent trades. It utilizes a combination of moving average crossovers and crossunders to generate entry and exit signals. The strategy is implemented in TradingView's Pine Script language.
The strategy begins by defining input variables such as take profit and stop loss levels, as well as the trading mode (long, short, or bidirectional). It then sets a rule to allow only long entries if the trading mode is set to "Long".
The strategy logic is defined using SMA (Simple Moving Average) crossover and crossunder signals. It calculates a short-term SMA (SMA3) and a longer-term SMA (SMA8), and plots them on the chart. The crossoverSignal and crossunderSignal variables are used to track the occurrence of the crossover and crossunder events, while the crossoverState and crossunderState variables determine the state of the crossover and crossunder conditions.
The strategy execution is based on the current position size. If the position size is zero (no open positions), the strategy checks for crossover and crossunder events. If a crossover event occurs and the trading mode allows long entries, a long position is entered. The entry price, stop price, take profit price, and stop loss price are calculated based on the current close price and the SMA8 value. Similarly, if a crossunder event occurs and the trading mode allows short entries, a short position is entered with the corresponding price calculations.
If there is an existing long position and the current close price reaches either the take profit price or the stop loss price, and a crossunder event occurs, the long position is closed. The entry price, stop price, take profit price, and stop loss price are reset to zero.
Likewise, if there is an existing short position and the current close price reaches either the take profit price or the stop loss price, and a crossover event occurs, the short position is closed and the price variables are reset.
The strategy also plots entry and exit points on the chart using plotshape function. It displays a triangle pointing up for a buy entry, a triangle pointing down for a buy exit, a triangle pointing down for a sell entry, and a triangle pointing up for a sell exit.
Overall, the MartinGale Scalping Strategy aims to capture small profits by taking advantage of short-term moving average crossovers and crossunders. It incorporates risk management through take profit and stop loss levels, and allows for different trading modes to accommodate different market conditions.

MA RSI @KINGThis Pine Script is designed to create a trading indicator with moving averages (MA) and relative strength index (RSI), along with arrow signals and background color changes based on those signals. Here's a description of its functions:
1. Moving Averages and RSI Calculation:
- Two moving averages (`fastMA` and `slowMA`) are calculated based on user-input lengths.
- The Relative Strength Index (`rsi`) is calculated based on a user-defined length.
2. Crossover Conditions:
- `crossoverUp` is true when the fastMA crosses above the slowMA and RSI is above an overbought level.
- `crossoverDown` is true when the fastMA crosses below the slowMA and RSI is below an oversold level.
3. Arrow Signals:
- Triangle-shaped arrows (`arrowUp` and `arrowDown`) are plotted below and above bars, indicating buy (green) and sell (red) signals, respectively.
4. Background Color Changes:
- The background color (`bgColor`) changes based on buy and sell signals.
- If there's a buy signal (`crossoverUp`), the background color is set to a light blue with 40% transparency.
- If there's a sell signal (`crossoverDown`), the background color is set to a light red with 40% transparency.
- On the next opposite signal, the background color is scaled up (transparency set to 80%) to indicate a stronger signal.
In summary, this script provides visual cues through arrows and background color changes to assist traders in identifying potential buy and sell signals based on moving average crossovers and RSI conditions. The background color variations aim to highlight the strength of the signal, with scaling based on consecutive signals in the same direction.
********************************************************************************
1. Buy Signal:
- Condition: The arrow points up (green) with a background color indicating a buy signal.
- Confirmation: Ensure that there is a strong upward crossover (fastMA above slowMA) and RSI is above the overbought level.
2. Sell Signal:
- Condition: The arrow points down (red) with a background color indicating a sell signal.
- Confirmation: Ensure that there is a strong downward crossover (fastMA below slowMA) and RSI is below the oversold level.
3. Exit Signal:
- Condition: No arrow is present, and the background color is reset.
- Confirmation: Confirm that there is no active buy or sell signal.
Example Trading Rules:
Opening a Long Position (Buy):
- Enter a long (buy) position when:
- The green arrow appears with a light blue background.
- Confirm that the fastMA is above the slowMA.
- Confirm that RSI is above the overbought level.
Opening a Short Position (Sell):
- Enter a short (sell) position when:
- The red arrow appears with a light red background.
- Confirm that the fastMA is below the slowMA.
- Confirm that RSI is below the oversold level.
Exiting a Position:
- Close the position when:
- There is no arrow present (neither green nor red).
- The background color is reset, indicating no active signal.
Risk Management:
Position Sizing: Determine the size of your positions based on your risk tolerance and the size of your trading account.
Stop-Loss and Take-Profit: Set stop-loss orders to limit potential losses and take-profit orders to secure profits.
Risk-Reward Ratio: Consider maintaining a favorable risk-reward ratio in your trades.
Notes:
Backtesting: Before applying this strategy in a live market, it's crucial to backtest it using historical data to assess its performance.
Market Conditions: Adapt the strategy to different market conditions, and be aware that no strategy is guaranteed to be profitable.
Continuous Monitoring: Regularly monitor the performance of the strategy and make adjustments as needed.
Educational Purpose: This strategy is for educational purposes only. Always consult with financial professionals and use your judgment when making trading decisions.
Remember that trading involves risk, and past performance is not indicative of future results. It's recommended to paper trade or use a demo account to test the strategy before risking real capital.
Best wishes on your trading journey! May your strategies be profitable, your risks well-managed, and your decisions guided by wisdom and success. Happy trading!
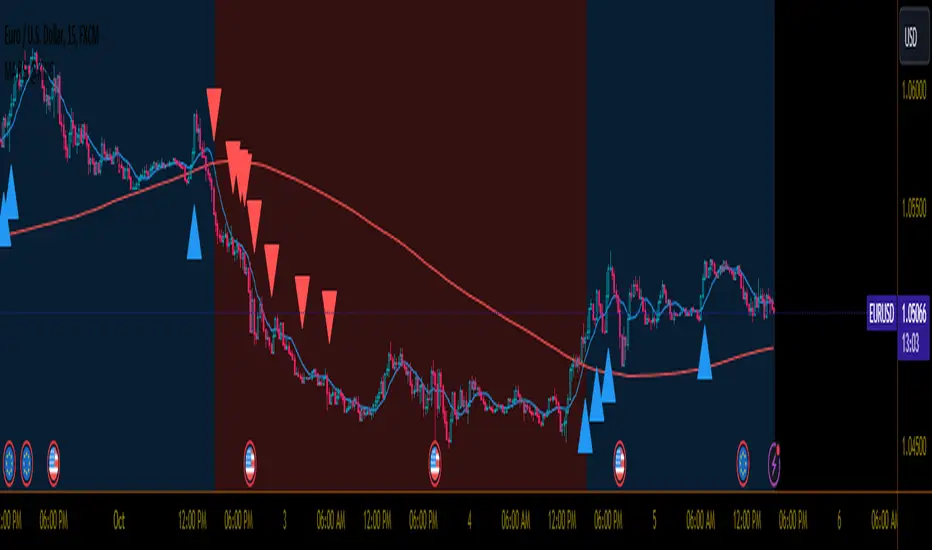
Volatility Channel Oscillator█ OVERVIEW
"Volatility Channel Oscillator" is a technical indicator that analyzes price volatility relative to dynamic price channels, displaying an oscillator, its moving average, and signals based on crossovers and divergences. The indicator offers customizable overbought and oversold levels, gradient visualization, and divergence detection, supported by alerts for key signals.
█ CONCEPTS
The VCO indicator creates dynamic price channels based on a moving average of the price (calculated as the arithmetic mean of the high and low prices: (high + low) / 2) and market volatility (measured as the average candle range and body size). These channels are not displayed on the chart but are used to calculate the oscillator value, which reflects the position of the closing price relative to the channel width, scaled to a range from -100 to +100, with the zero line as the central point. A moving average of the oscillator (SMA) smooths its values, enabling signals based on crossovers with the zero line or overbought/oversold levels. The indicator also detects divergences between price and the oscillator, which may indicate potential trend reversals. VCO is useful for identifying market momentum, reversal points, and trend confirmation, especially when combined with other technical analysis tools.
█ FEATURES
- Volatility Channels: Calculates invisible chart boundaries based on a simple moving average (SMA) of the price (high + low) / 2 and volatility (average candle range and body). The length parameter (default 30) sets the SMA length, and scale (default 200%) adjusts the channel width.
- Oscillator: Determines the oscillator value in the range of -100 to +100, indicating the closing price's position relative to the volatility channel. Displayed with dynamic coloring (green for positive values, red for negative).
- Oscillator Moving Average: A simple moving average (SMA) of the oscillator values, smoothing its movements. The signalLength parameter (default 20) defines the SMA length. Displayed in yellow with an optional gradient.
- Overbought/Oversold Levels: Configurable thresholds for the oscillator (overbought, default 50; oversold, default -50) and its moving average (maOverbought, default 30; maOversold, default -30), shown as horizontal lines with optional gradients. Band colors change dynamically (red for overbought, green for oversold, gray for neutral) based on the moving average's position relative to maOverbought/maOversold, reinforcing other signals.
- Divergences: Detects bullish (price forms a lower low, oscillator a higher low) and bearish (price forms a higher high, oscillator a lower high) divergences using pivots (pivotLength, default 2). Divergences are displayed with a delay equal to the pivot length; larger lengths increase reliability but delay signals. Use as additional confirmation.
Signals:
- Overbought/Oversold Crossovers: Green triangles (buy) when the oscillator crosses above the oversold level, red triangles (sell) when it crosses below the overbought level.
- Zero Line Crossovers: Buy/sell signals when the oscillator crosses the zero line upward (buy) or downward (sell).
- Moving Average Crossovers: Buy/sell signals when the oscillator's moving average crosses the zero line or the maOverbought/maOversold levels. Dynamic band color changes (red/green) at these crossovers reinforce other signals.
- Visualization: Gradient lines for the oscillator, its moving average, overbought/oversold levels, and zero line, with adjustable transparency. Gradient fill between the oscillator and zero line.
Divergence Labels: "Bull" (bullish) and "Bear" (bearish) labels with customizable color and transparency.
- Alerts: Built-in alerts for divergences, overbought/oversold crossovers, and zero line crossovers by the oscillator and its moving average.
█ HOW TO USE
Add to Chart: Apply the indicator via Pine Editor or the Indicators menu on TradingView.
Configure Settings:
- Channel and Oscillator Settings: Adjust the channel SMA length (length, default 30) and channel scaling (scale, default 200%). Increase scale for high-volatility markets.
- Threshold Levels: Set oscillator overbought (overbought, default 50) and oversold (oversold, default -50) levels, and moving average thresholds (maOverbought, default 30; maOversold, default -30).
- Divergence Settings: Enable/disable divergence detection (calculateDivergence) and set pivot length (pivotLength, default 2). Larger values increase reliability but delay signals.
- Signal Settings: Choose signal types (signalType): overbought/oversold, zero line, moving average, or all.
- Styling: Customize colors for the oscillator, moving average, horizontal levels, and divergence labels. Adjust gradient and fill transparency.
Interpreting Signals:
- Buy Signals: Green triangles below the bar when the oscillator or its moving average crosses above the oversold level or zero line.
- Sell Signals: Red triangles above the bar when the oscillator or its moving average crosses below the overbought level or zero line.
- Moving Average Signals: Green/red triangles when the moving average crosses maOverbought/maOversold levels, indicating potential reversals or trend continuation. Dynamic band color changes (red for overbought, green for oversold) at these crossovers reinforce other signals.
- Divergences: "Bull" (bullish) and "Bear" (bearish) labels indicate potential trend reversals with a delay based on pivot length. Use as confirmation.
- Overbought/Oversold Levels: Monitor price reactions in these zones as potential reversal points. Dynamic band color changes based on the moving average reinforce signals.
Signal Confirmation: Use VCO with other tools, such as pivot levels (for key turning points) or Fibonacci levels (for support/resistance zones).
█ APPLICATIONS
- Trend Trading: Zero line crossovers by the oscillator or its moving average identify momentum in uptrends or downtrends.
- Range Trading: Overbought/oversold levels help identify entry/exit points in sideways markets.
- Divergences: Use bullish/bearish divergences as additional confirmation of reversals, especially near key price levels.
- Trend Identification: To analyze trends over a longer perspective, increase the moving average length (signalLength) for more stable signals.
█ NOTES
- Test the indicator across different timeframes and markets to optimize parameters, such as length and scale, for your trading style.
- In strong trends, overbought/oversold levels may persist, requiring additional signal verification.
- Divergences are more reliable on higher timeframes (H4, D1), where market noise is reduced, but their delay requires caution.
- In low-liquidity markets, signals may be less effective, so use on high-liquidity assets is recommended.
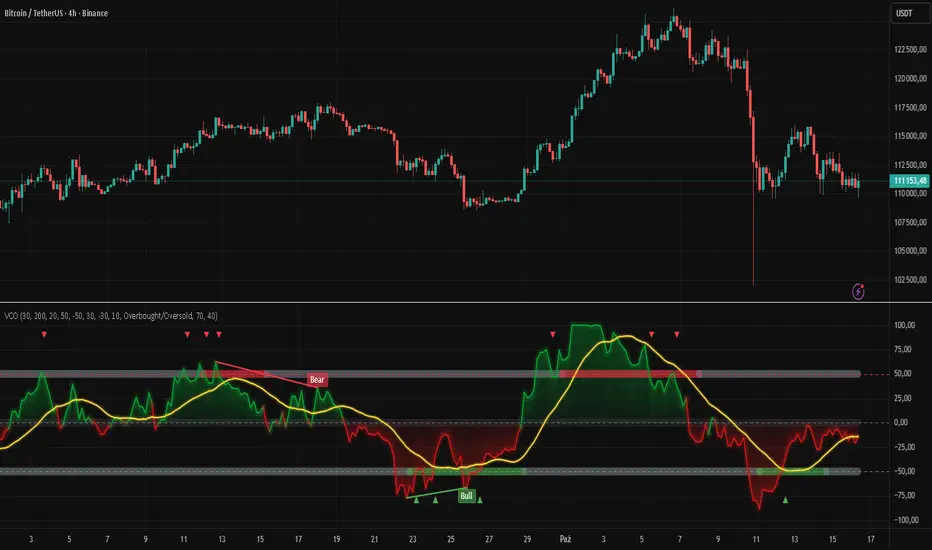
SMA Crossover with RSI ConfirmationThis is a sniper entry indicator that provides Buy and Sell signals using other Indicators to give the best possible Entries
Moving Average Crossovers:
The indicator uses two moving averages: a short-term SMA (Simple Moving Average) and a long-term SMA.
When the short-term SMA crosses above the long-term SMA, it generates a buy signal (indicating potential upward momentum).
When the short-term SMA crosses below the long-term SMA, it generates a sell signal (indicating potential downward momentum).
RSI Confirmation:
The indicator incorporates RSI (Relative Strength Index) to confirm the buy and sell signals generated by the moving average crossovers.
RSI is used to gauge the overbought and oversold conditions of the market.
A buy signal is confirmed if RSI is below a specified overbought level, indicating potential buying opportunity.
A sell signal is confirmed if RSI is above a specified oversold level, indicating potential selling opportunity.
Dynamic Take Profit and Stop Loss:
The indicator calculates dynamic take profit and stop loss levels based on the Average True Range (ATR).
ATR is used to gauge market volatility, and the take profit and stop loss levels are adjusted accordingly.
This feature helps traders to manage their risk effectively by setting appropriate profit targets and stop loss levels.
Combining the information provided by these, the indicator will provide an entry point with a provided take profit and stop loss. The indicator can be applied to different asset classes. Risk management must be applied when using this indicator as it is not 100% guaranteed to be profitable.

MULTI TF SCANNERMulti-Timeframe Moving Average Scanner Script
This script is designed to scan multiple timeframes for specific moving average (MA) crossovers to help traders identify potential buy or sell signals. The moving averages, such as the Simple Moving Average (SMA) or Exponential Moving Average (EMA), are calculated for different timeframes, allowing the script to provide a comprehensive analysis of the market trend.
Features:
Multiple Timeframe Analysis:
The script scans across various timeframes, including 5 minutes, 15 minutes, 1 hour, 4 hours, 1 day, and 1 week.
The moving averages are calculated for each of these timeframes, enabling the trader to gauge trends across short, medium, and long-term periods.
MA Crossover Detection:
The script checks for crossovers between a fast-moving average (e.g., 9-period) and a slow-moving average (e.g., 50-period).
A bullish crossover (fast MA crossing above slow MA) signals a potential buy, while a bearish crossover (fast MA crossing below slow MA) signals a potential sell.
Recursive Timeframe Check:
Before generating a buy or sell signal, the script checks for confirmations from higher timeframes.
Signals are only generated when the crossovers align across multiple timeframes (e.g., a buy signal on the 5-minute chart is confirmed by a bullish crossover on the 1-hour and 4-hour charts).
Signal Quality Indicator:
The script assigns a quality score to each signal based on how many higher timeframes confirm the crossover.
A stronger confirmation across multiple timeframes increases the quality of the signal, which can be visualized on the chart.
Optimized for Performance:
The calculations for moving average crossovers are designed to minimize unnecessary recalculations, optimizing the script’s performance and reducing lag.
The multi-timeframe checks are done only when the moving average crossover occurs or changes, ensuring efficiency.
User-Friendly Interface:
The results are displayed on the chart with clear visual cues to indicate the buy/sell signals and signal strength.
The script is minimalistic, with an uncluttered interface, providing the user with only the most relevant information for making trading decisions.